The UK Government Gave 1,000 Staff Copilot for Three Months. They used it once a day.
Satisfaction was high. Nothing measurable moved.

A VP of IT told Andy Berman, chief executive of Runlayer and formerly director of AI at Zapier, this month that his department is still on Copilot, ten months after the board told the CEO to go all in. It landed as a punchline. It is worth knowing what being on Copilot actually produced, because somebody measured it.
Almost everything written about AI at work is a survey. Somebody rolled a tool out, asked people whether they liked it, and published the percentage who said yes.
The UK Department for Business and Trade did something rarer. It gave a thousand civil servants Microsoft 365 Copilot for three months, measured what they actually did with it, and published the result with no commercial reason to flatter anyone.
Seventy-two actions each, in three months
The monitoring dashboard recorded an average of 72 Copilot actions per user across the whole pilot. There were 63 working days in it. That works out at 1.14 actions per person per day.
Around 64% of licence holders used it at least once in a given week. Only about 30% used it at least once per working day.
Now the number that would have been in the press release. 72% of respondents said they were satisfied or very satisfied, with a Net Promoter Score of 31, which is a good score.
72%
Satisfied or very satisfied with Copilot.
1.14
Copilot actions per user per working day.
30%
Used it at least once on a working day.
Those describe the same three months and the same thousand people. If you have ever been handed a satisfaction survey after an AI rollout and read it as evidence, this is the study that tells you what it was evidence of.
1,000 licences · 63 working days
1.14Copilot actions per user, per working day72 recorded actions across 63 working days
Their conclusion, with the caveat they attached to it
The report's own wording is worth quoting exactly, including the sentence that follows it, which most summaries drop:
We did not find robust evidence to suggest that time savings are leading to improved productivity. However, this was not a key aim of the evaluation and therefore limited data was collected to identify if time savings have led to productivity gains.
That caveat is real and it belongs in any honest reading. The department did not set out to measure productivity, so the absence of evidence is weaker than it first sounds.
The control group is the harder detail. Colleagues who did not receive Copilot had not observed any productivity improvement in the people who did. Nobody was looking for that result, and it does not depend on the study's instrumentation.
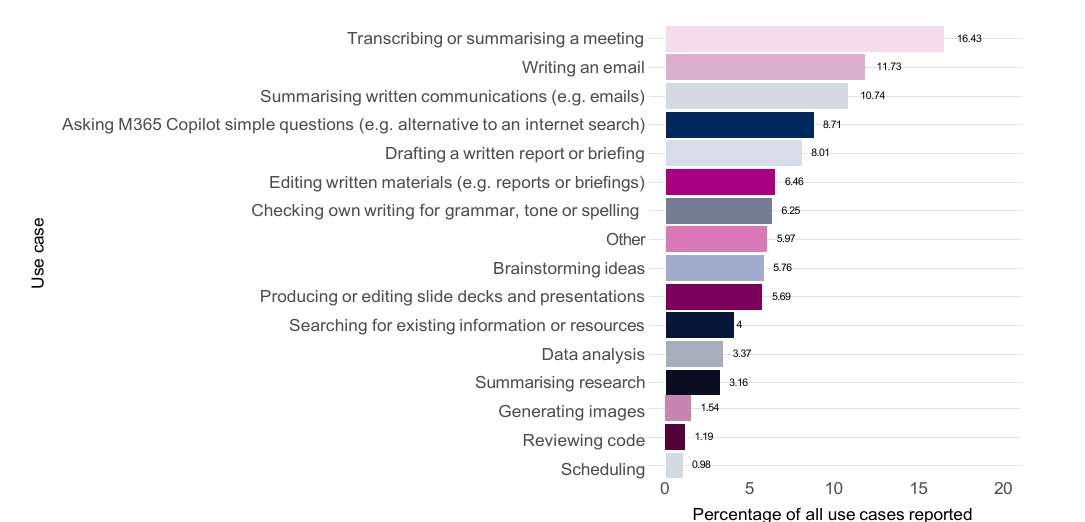
The department's own chart, from its published evaluation (N = 1,424 reported use cases). Open Government Licence v3.0.
The tasks split, and not all one way
Underneath the headline numbers, the department watched people perform specific tasks with and without the tool. The results do not line up behind a single verdict.
Summarising reports was a real win and a large one. 12 minutes 37 against 41 minutes 34 without Copilot, and better accuracy with it, 4 against 2.5 out of 5. Written tasks in general showed the largest time savings and drew the highest satisfaction.
Excel went the wrong way on both axes at once. Copilot users completed data analysis more slowly, 25:01 against 20:33, and scored worse on accuracy and quality. Slides came out faster, 10:47 against 18:30, but scored 1 out of 5 on quality against 2, and 1.5 on accuracy against a clean 5. Writing emails saved thirteen seconds.
Scheduling and image generation took longer with Copilot than without it, either because the tool could not produce a usable output or because the task existed only because the tool did.
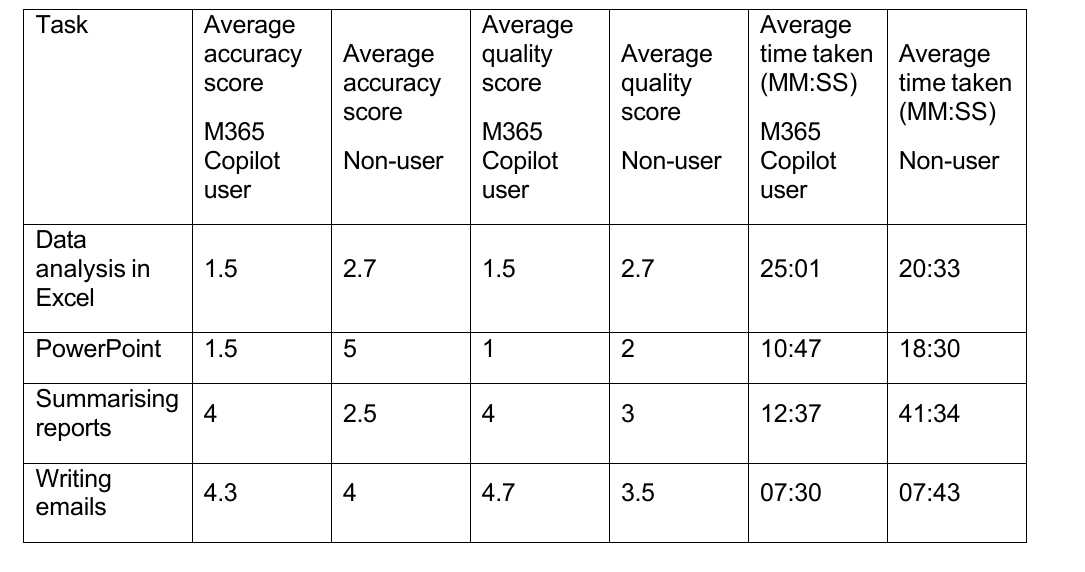
Reproduced so you can check the figure against the source rather than take it on trust. Open Government Licence v3.0.
That caveat is the department's own and it matters. The 1.14 and the 72% come from monitoring data and a full survey. The task scores come from a small number of watched sessions. Treat the first pair as findings and the second as texture.
Two results that cut the other way
Copilot was significantly more satisfying for neurodiverse colleagues, a statistically significant difference rather than an anecdote, and non-native English speakers reported real benefits. Where the tool met an actual need, it met it.
That is the same finding as everything else here, seen from the other side. The gains were individual, they were genuine, and they stayed individual.
Which is why this reads as a verdict on how the rollout was authorised, not on Microsoft. A licence is the one move open to somebody who controls a budget and not the work, and the same pattern shows up across whole economies: 9% of firms with AI in production in the country leading Europe, and 1% of companies carrying 90% of the spend.
The two numbers worth having
If you are running a rollout you already have both of them, and neither is in your satisfaction survey. Actions per user per working day. And whether anyone outside the pilot can tell it happened.
The department collected both. That is what makes this the most useful three months of AI evidence anyone has published, a year after it ended.
Measure the actions.

Founder of nativefirst.ai. Runs everything on agents and writes down what works.